In the world of business intelligence, efficiency is everything. Companies rely on tools such as IBM Planning Analytics to manage complex planning, budgeting and forecasting processes. But where processes run, errors can occur – and this is exactly where the TM1 Debugger comes in with targeted analysis.
Note: For historical reasons, the term “TM1” is often still used synonymously for “IBM Planning Analytics”, but today it officially only refers to the database engine.
What is the TM1 debugger?
The TM1 Debugger is a tool specifically designed to help developers and power users debug TurboIntegrator (TI) processes. TI processes are the backbone of many data processing steps in TM1 – whether data import, transformation or calculations.
Important to know: The debugger is designed exclusively for TI processes. Functions such as Rules, PAfE or TM1 Web are not supported.
The debugger is deactivated by default – however, it can be activated without restarting the database via the administration or the config file.
Why do you need a debugger in TM1?
TI processes consist of several script sections such as Prolog, Metadata, Data, Epilog. Errors in these sections can lead to data being loaded incorrectly or business logic not being executed correctly. With the TM1 Debugger you can:
- Set breakpoints
- Execute lines of code step by step
- Monitor variable values at runtime
- Identify runtime errors
This saves time, reduces frustration and significantly improves the quality of your TM1 solutions.
Typical use cases for the TM1 debugger
- Troubleshooting for data imports:
If a CSV import does not work as expected, the debugger shows exactly which line and which condition causes the process to fail. - Verification of complex calculations:
Especially with nested if conditions or lookups, it is easy to lose track. The debugger helps you to understand the logic step by step. - Optimization of performance:
Not every error is a showstopper – sometimes it’s simply a matter of performance tuning. Processes can be accelerated through the targeted testing of individual sections.

How do I activate the debugger?
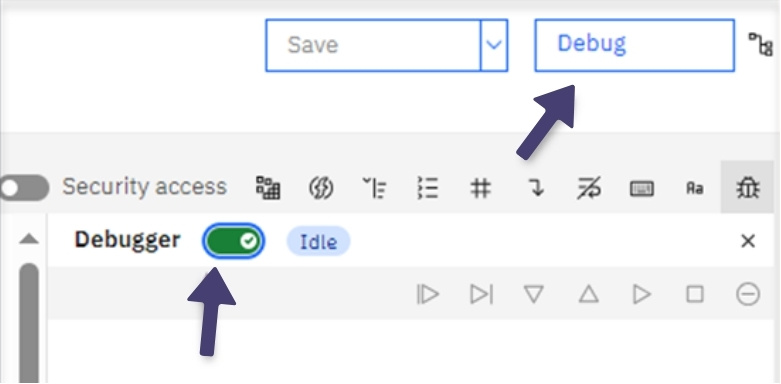
The debugger is part of the IBM Planning Analytics Workspace (PAW). Here is a short guide:
- Open your process in the IBM Planning Analytics Workspace (PAW).
- Click on “Activate debug mode” at the top right.
- Set breakpoints (e.g. in the Metadata section).
- Start the process via “Start Debug”.
- Use “Step Into” and “Step Over” to run through lines.
- Check variable values live in the debug console.
Note: There is no native debug function for older TM1 versions or users without PAW access – workarounds with ASCII output, logging or temporary cubes are necessary here.
Where does the TM1 debugger reach its limits?
As helpful as the debugger is for analyzing TI processes, it cannot be used universally. It currently only works in IBM Planning Analytics Workspace (PAW) from version 2.0.60. Anyone working with older PAW versions or tools such as TM1 Web and Planning Analytics for Excel (PAfE) must fall back on alternative debugging methods for the time being.
However, IBM is constantly developing the debugger further. In more recent versions, for example, automatic completion has been improved and the display of active variables has been made clearer. Further functions are already being planned – the aim is to make debugging even more efficient, intuitive and comprehensive.
Conclusion: The TM1 debugger saves time and nerves
The TM1 debugger not only saves time and nerves – it brings structure and transparency to your processes. Especially in complex BI landscapes, the debugging feature in PAW is an indispensable tool for developers and power users. If you want to work productively, you should make the debugger an integral part of your workflow.


